HUMAN CENTERED DESIGN | FOUNDATION
Stakeholder Map
60 Min
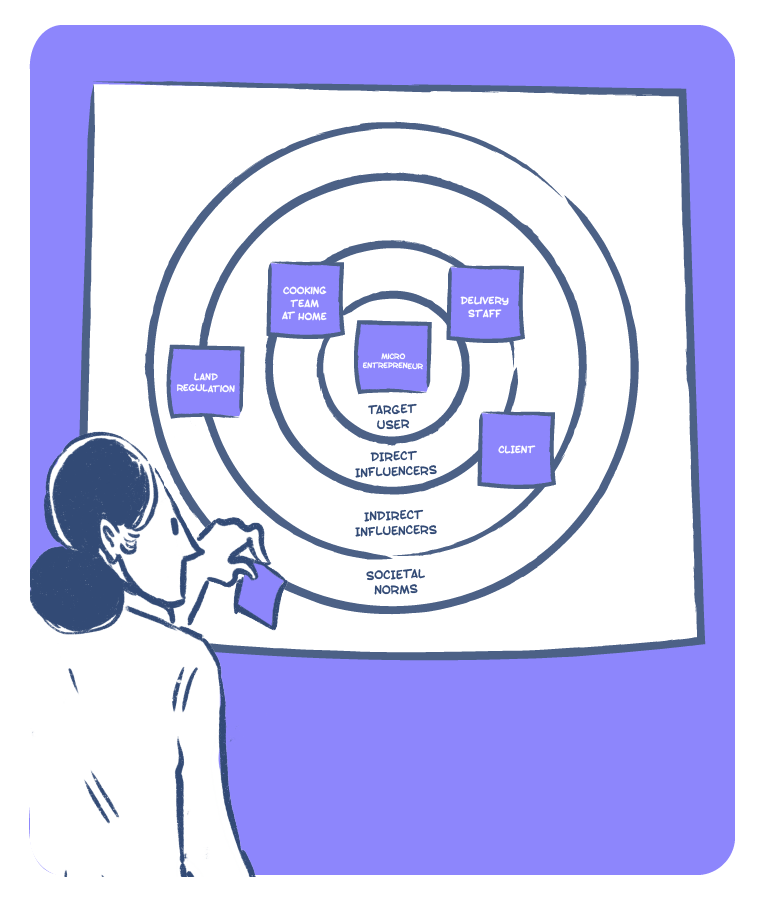
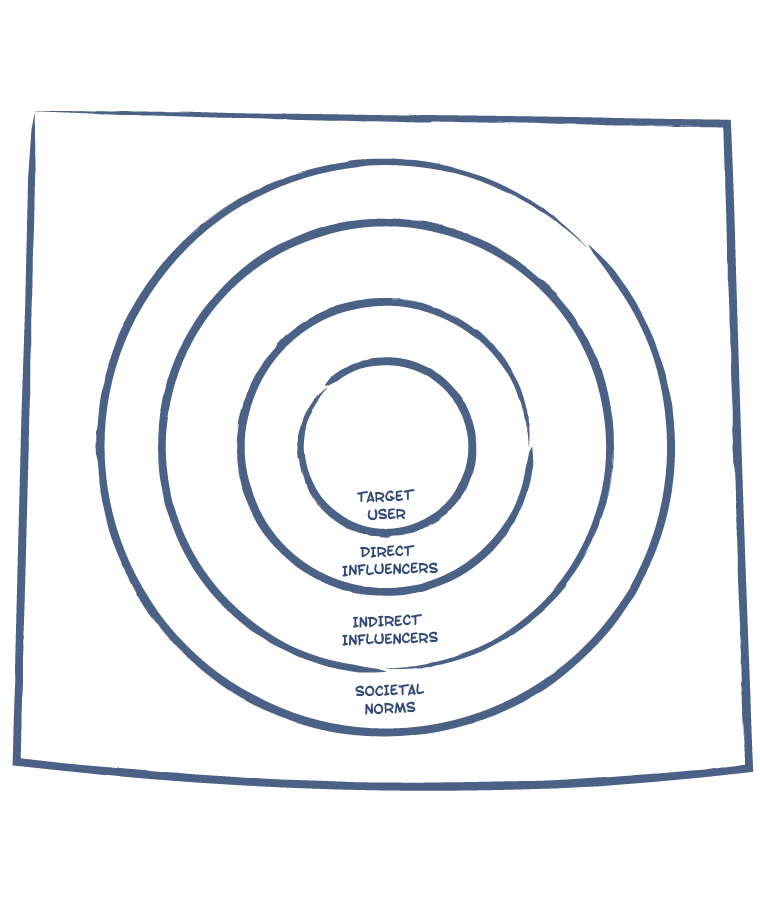
Stakeholder Maps are used to visualise ecosystems - people, institutions, organisations, and other entities that have an influence on or stake in a problem/opportunity area. While target users/audiences form the center of the map, entities mapped on two concentric circles around the user depict direct (1st circle) and indirect (2nd circle) stakeholders. A robust mapping of ecosystems helps approach research and design in a more holistic manner.
USE CASES
- Map the ecosystem of users and stakeholders relevant to a problem.
- Identify gaps and priorities with regard to understanding an ecosystem.
LIMITATIONS
The Stakeholder Map does not exactly describe the nature of the relationship between target user and the stakeholders. It also has limited ability to describe relationships between stakeholders. The ERAF Diagram may be used to map more complex ecosystems.